Operational and commercial data of the diving center are collected in a single analytics section, transforming daily activity into valuable insights to monitor trends and performance. Statistics allow you to analyze activities, resource usage, dive sites, equipment rentals, and customer origin.
The software is integrated via API with a weather service and automatically collects meteorological and sea conditions data at regular intervals. This information is stored and used to analyze the diving center’s performance over time, helping to interpret anomalies or variations also in relation to the weather conditions recorded on specific days at the location where the diving center operates.
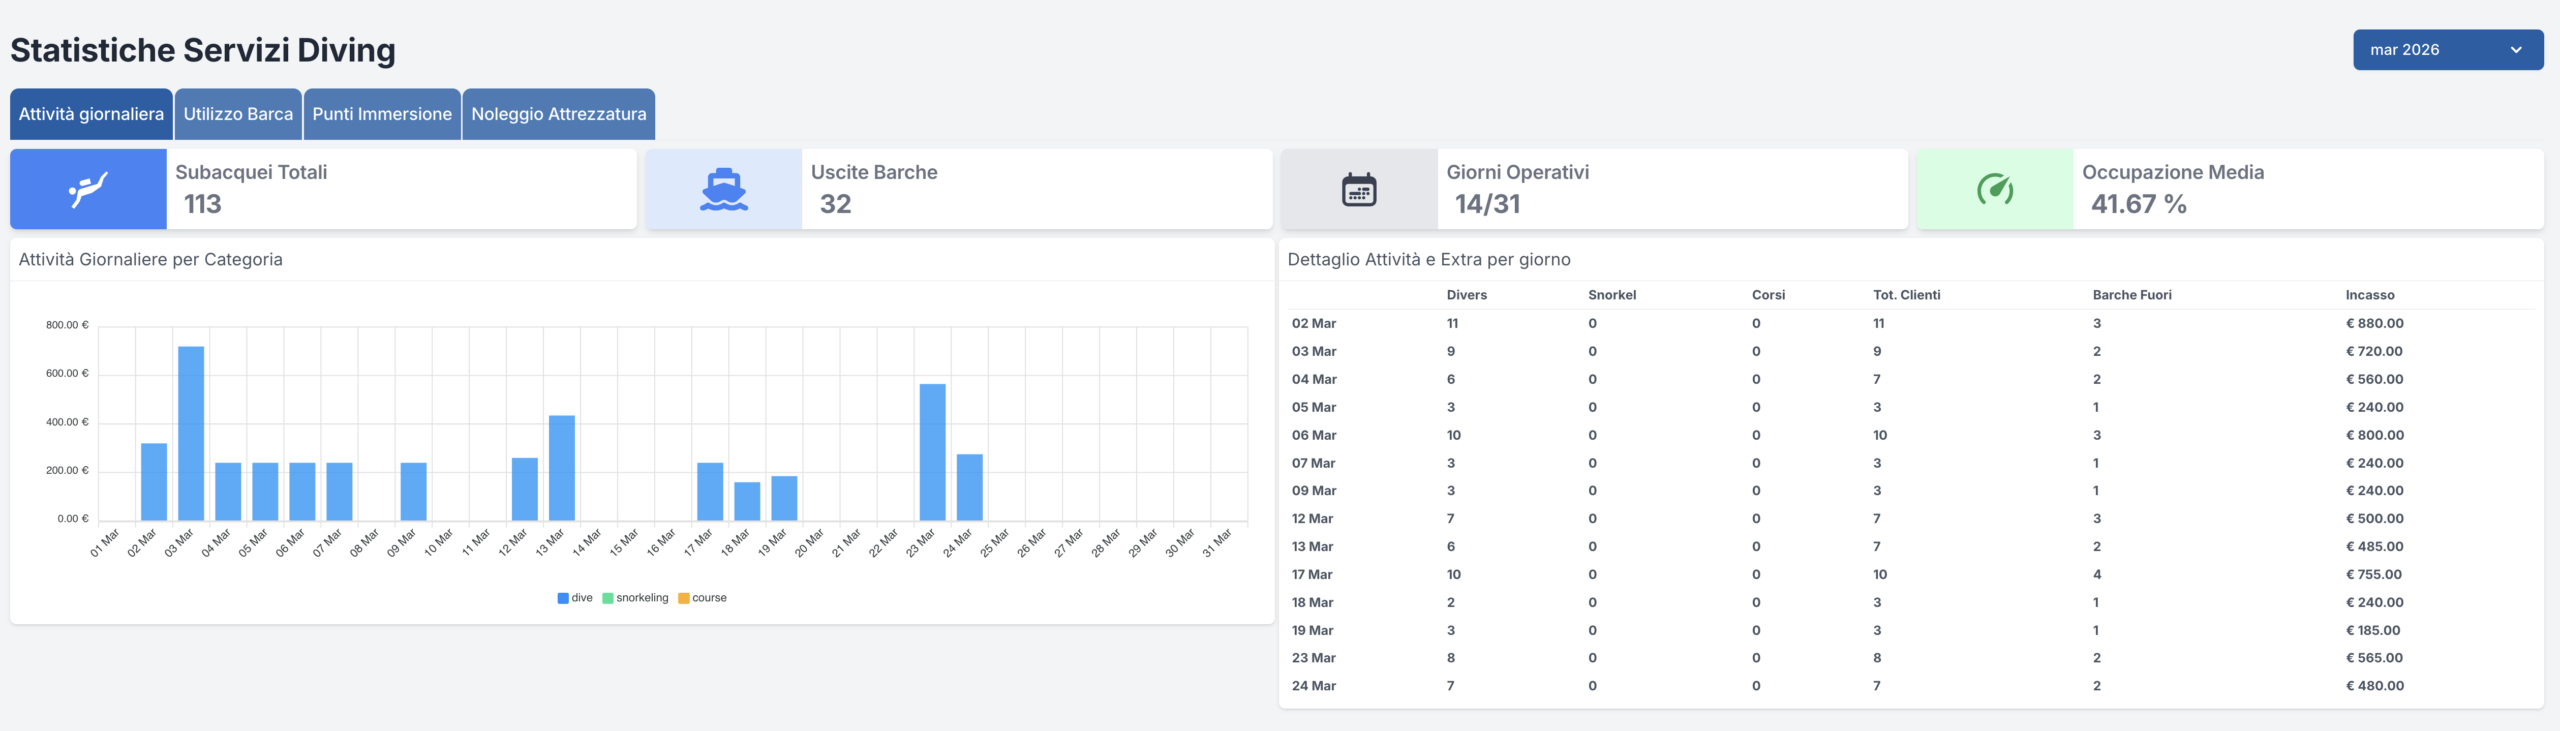
The statistics section displays key indicators such as total divers per month, total trips, operational days, and average boat occupancy. These summary boxes provide an instant overview of the selected period and help understand overall performance.
A dedicated chart shows the daily distribution of services, while a detailed table reports, for each day, boats out, customers onboard, total revenue, and number of activities divided into dives, courses, and snorkeling. This provides a clear view of how each operational day develops, highlighting peak and low activity periods
Having clear data on daily operations helps identify seasonality, workload, and activity distribution. This allows the diving center to plan staff, boats, and availability more effectively.
A dedicated section shows total trips carried out, average trips per boat, operational days, and average occupancy per boat. This is complemented by charts and detailed tables that help understand which boats are used the most and at what capacity levels.
Statistics also allow analysis of dive sites, with charts showing trips carried out, dives distributed over time, and monthly and yearly summaries. This view is useful for evaluating seasonality, site rotation, and the operational importance of each location.
A specific section is dedicated to rentals, with indicators such as total rentals, most used equipment, most requested subcategories, and generated revenue. It is a key tool to understand which items perform best and to better plan purchases, replacements, and availability.
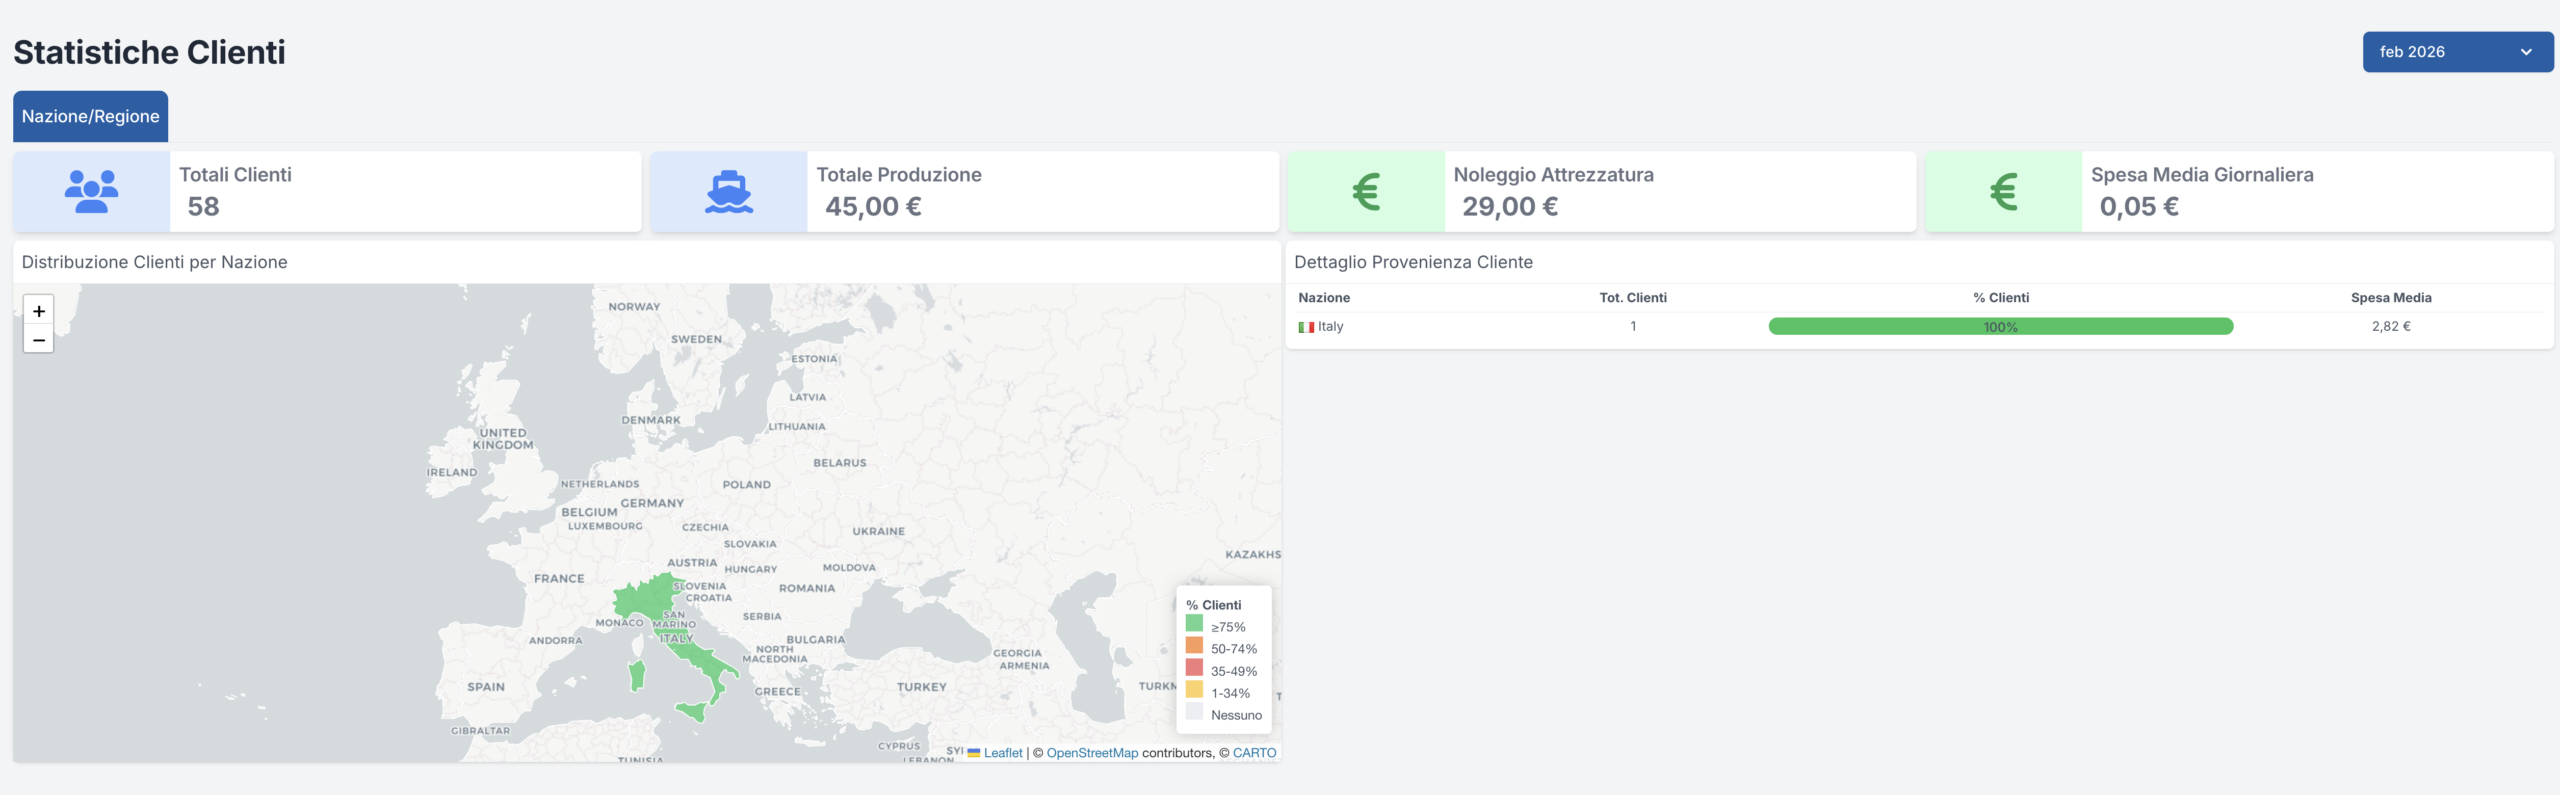
AquaDivePro also includes a dedicated customer section, with summary boxes showing total number of customers, total revenue, revenue from equipment rentals, and average daily spending. These indicators help understand not only how many people visit the diving center, but also the economic value they generate.
Customer distribution by country and detailed origin data make it possible to understand which markets your customers come from and the spending behavior associated with each geographic area.
This feature is designed for diving centers working with international tourism and looking to better understand the weight of different markets.
Statistics are not just for “looking at numbers,” but for supporting more informed decisions on offers, seasonality, organization, and marketing. Knowing which activities perform best, which markets are strongest, and which resources are most used helps the diving center improve over time.
Digitizing reports helps diving centers turn operational data into practical tools for analysis and improvement.
• Clear overview of activities and performance
• Control over boat usage and dive sites
• Analysis of equipment rentals and profitability
• More accurate understanding of customer origin
• Better support for operational and commercial decisions
Infoelba s.r.l. Unipersonale
Viale Teseo Tesei, 12 – 57037 Portoferraio (LI)
Isola d’Elba – Italia
P. IVA e C.F. 01130150491
capitale sociale €10.000,00 i.v.
registro imprese numero 01130150491
REA: LI – 100635